Walht: create graphs using a spreadsheet and to analyse data in those displays.
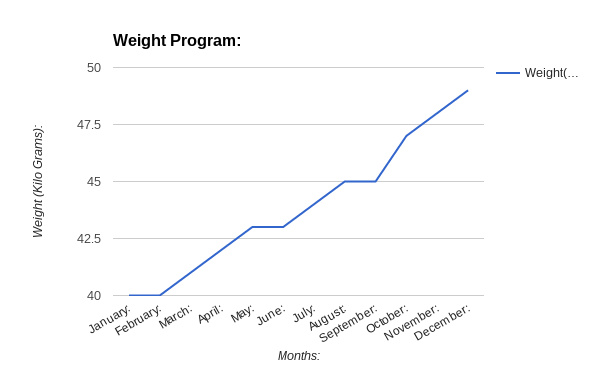
This graph shows that Emily began weight building which is creating muscles to get stronger
and fitter. In the graph it shows that her weight went from 40 kg to 49 kg.
Well done RJ. Reading closely supports your ability to analyze data represented in graphs.
ReplyDelete